Vektorové dlaždice
Vektorové dlaždice je možné v Geoserveru generovat jenom z vektorových vrstev. Generovat vektorové dlaždice můžeme bez instalace pluginu ve formátu application/json;type=utfgrid .
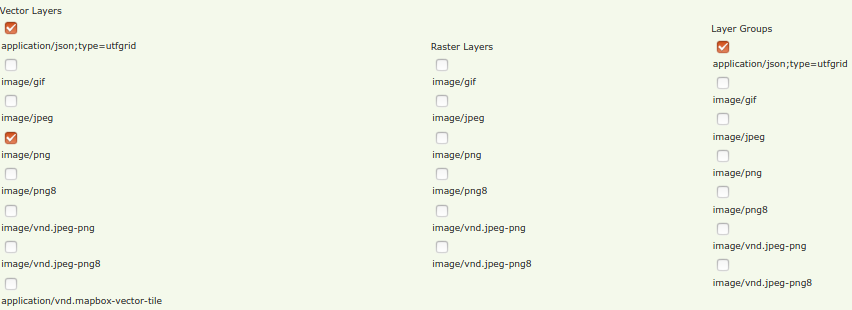
Pro další možnosti potřebujeme nainstalovat extenzi Vector Tiles.
Najdeme ji na stránkách Geoserveru. Soubory z archivu uložíme do webapps/geoserver/WEB-INF/lib
a restartujeme server.
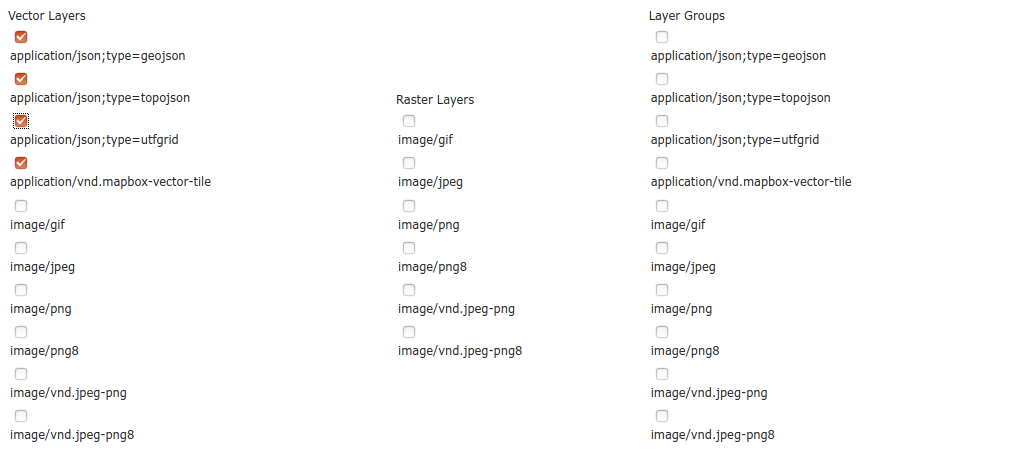
Instalací extenze nám přibyla možnost generovat vektorové dlaždice ve formátech application/json;type=geojson, application/json;type=topojson nebo application/vnd.mapbox-vector-tile. Rozdíly mezi formáty GeoJSON a TopoJSON jsou popsány v materiálech ke školení Úvod do GIS https://training.gismentors.eu/open-source-gis/formaty/vektor.html Formát application/vnd.mapbox-vector-tile generuje binární soubor s příponou pbf. Tento formát je tvůrci Geoserveru doporučovaný. Data ve vektorových dlaždicích jsou generalizovaná, čím nižší úroveň přiblížení, tím je generalizace větší. Na rozdíl od rastrových dlaždic, nemají vektorové dlaždice v sobě informaci o stylu.
Proto pokud chceme data vizualizovat na straně klienta musíme stylování nastavit v jeho konfiguraci.
<!DOCTYPE html -->
<html>
<head>
  <title>Vector tiles</title>
  <script src="ol.js"></script>
  <link rel="stylesheet" href="ol.css">
  <style>
    html, body {
      font-family: sans-serif;
      width: 100%;
    }
    .map {
      height: 500px;
      width: 100%;
    }
  </style>
</head>
<body>
  <h3>Mapbox Protobuf - vector tiles</h3>
  <div id="map" class="map"></div>
  <script>
// definování stylu
  var style_simple = new ol.style.Style({
    fill: new ol.style.Fill({
      color: '#ADD8E6'
    }),
    stroke: new ol.style.Stroke({
      color: '#880000',
      width: 1
    })
  });
  function simpleStyle(feature) {
    return style_simple;
  }
//definice vrstvy
  var layer = 'sf:restricted';
//definice čísla EPSG
  var projection_epsg_no = '900913';
  var map = new ol.Map({
    target: 'map',
    view: new ol.View({
//souřadnice středového bodu
      center: [-11559399.021158619, 5534556.797017269],
//počáteční zoom
      zoom: 12
    }),
    layers: [new ol.layer.VectorTile({
      style:simpleStyle,
      source: new ol.source.VectorTile({
        tilePixelRatio: 1, // oversampling when > 1
        tileGrid: ol.tilegrid.createXYZ({maxZoom: 19}),
        format: new ol.format.MVT(),
        url: '/geoserver/gwc/service/tms/1.0.0/' + layer +
            '@EPSG%3A'+projection_epsg_no+'@pbf/{z}/{x}/{-y}.pbf'
      })
    })]
  });
  </script>
</body>
</html>
Kód vložíme do textového souboru a pojmenujeme ho index.html. Připravený index.html a i knihovny pro javascript si můžete stáhnou zde: vectortiles.zip. Stažený archiv rozbalíme do složky /geoserver-2.16.2/data_dir/www. Táto aplikace nám umožní si zobrazit vektorové dlaždice ve formátu application/vnd.mapbox-vector-tile.
Aplikace je pak dostupná na http://localhost:8080/geoserver/www/vektortiles/index.html
Stylování je možné měnit přímo na straně klienta, tak jak demonstruje mírně upravený předchozí příklad.
<!DOCTYPE html -->
<html>
<head>
  <title>Vector tiles</title>
  <script src="ol.js"></script>
  <link rel="stylesheet" href="ol.css">
  <style>
    html, body {
      font-family: sans-serif;
      width: 100%;
    }
    .map {
      height: 500px;
      width: 100%;
    }
  </style>
</head>
<body>
  <h3>Mapbox Protobuf - vector tiles</h3>
  <input id="fill" value="#FF0000"/><button onclick="setFill()">Set fill</button>
  <div id="map" class="map"></div>
  <script>
  // definování stylu
  var fill = '#ADD8E6';

  function getStyle() {
    return new ol.style.Style({
    fill: new ol.style.Fill({
      color: fill
    }),
    stroke: new ol.style.Stroke({
      color: '#880000',
      width: 1
    })
  });
  }

  var style_simple = getStyle();

  function setFill() {
    fill = document.getElementById('fill').value;
    style_simple = getStyle();
    map.removeLayer(layer);
    layer = getLayer();
    map.addLayer(layer);
  }

  function simpleStyle(feature) {
    return style_simple;
  }

  function getLayer() {
    return new ol.layer.VectorTile({
      style:simpleStyle,
      source: new ol.source.VectorTile({
        tilePixelRatio: 1, // oversampling when > 1
        tileGrid: ol.tilegrid.createXYZ({maxZoom: 19}),
        format: new ol.format.MVT(),
        url: '/geoserver/gwc/service/tms/1.0.0/' + layer_name +
            '@EPSG%3A'+projection_epsg_no+'@pbf/{z}/{x}/{-y}.pbf'
      })
    })
  }

  //definice vrstvy
  var layer_name = 'sf:restricted';
  //definice čísla EPSG
  var projection_epsg_no = '900913';
  var layer = getLayer()
  var map = new ol.Map({
    target: 'map',
    view: new ol.View({
      //souřednices středového bodu
      center: [-11559399.021158619, 5534556.797017269],
      //počáteční zoom
      zoom: 12
    }),
    layers: [layer]
  });
  </script>
</body>
</html>