Unit 11 - PyGRASS scripting
Let’s start with a Python script created by Graphical Modeler in
Unit 10. Run this script from the main toolbar
by  Launch user-defined script.
Note
Before starting the script GRASS will ask about adding a script directory path into GRASS_ADDON_PATH. It can be useful if you will run script(s) from this directory more often. Then you don’t need to define full path to scripts, script name will be enough.
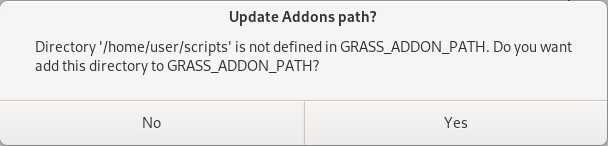
Fig. 74 Add script directory into GRASS Addon Path.
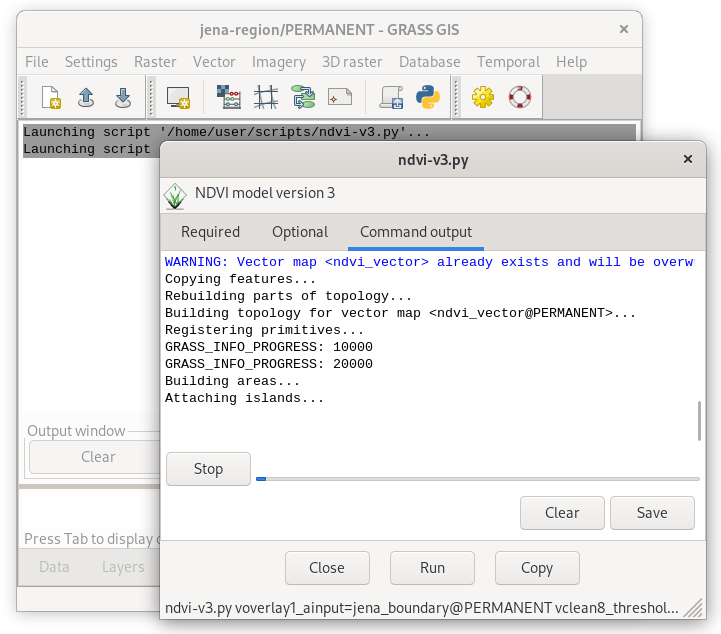
Fig. 75 Script output is printed into Console tab.
Python script generated by Graphical Modeler is based on GRASS Scripting Library. As a first step the script will be rewritten into PyGRASS syntax.
PyGRASS syntax
Open exported Python script by your favorite editor or if your do not
have any just use GRASS-integrated Python editor  Open
a simple Python code editor.
Open
a simple Python code editor.
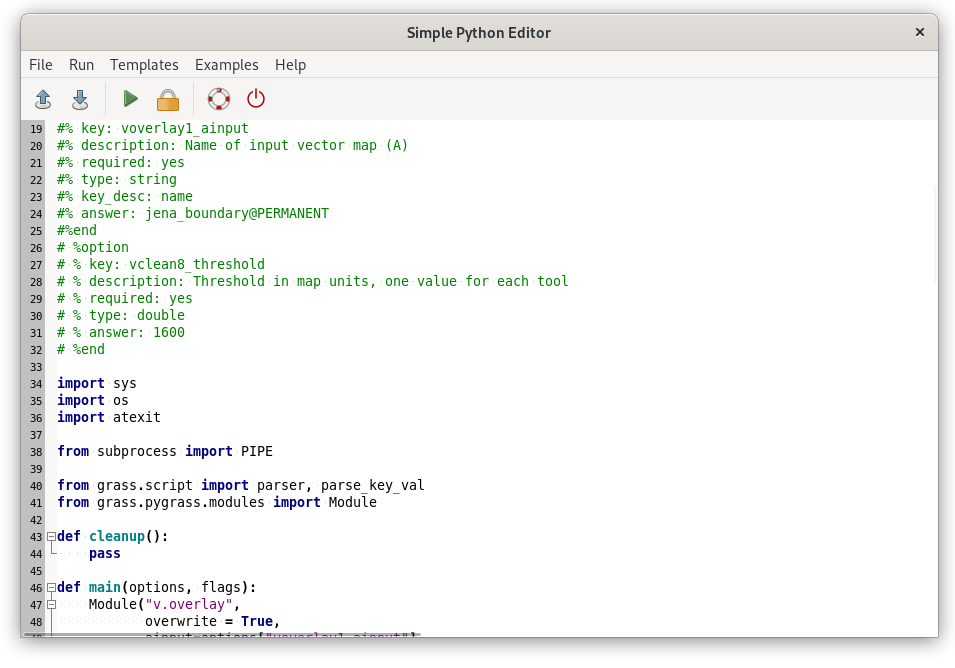
Fig. 76 Simple GRASS Python code editor in action.
Load script by  Open and replace every occurence of
core.run_command function by PyGRASS
equivalent. PyGRASS allows calling GRASS tools (modules) similarly as
GRASS Scripting Library does (see Unit 10 - Python intro). The module caller is
represented by Module class. In contrast to GRASS
Scripting Library which defines several routines to run module
(core.run_command, core.read_command,
or core.parse_command) in PyGRASS there is only one
caller technique.
Open and replace every occurence of
core.run_command function by PyGRASS
equivalent. PyGRASS allows calling GRASS tools (modules) similarly as
GRASS Scripting Library does (see Unit 10 - Python intro). The module caller is
represented by Module class. In contrast to GRASS
Scripting Library which defines several routines to run module
(core.run_command, core.read_command,
or core.parse_command) in PyGRASS there is only one
caller technique.
Replace all occurrence of core.run_command function by Module caller, see example below.
from grass.script import run_command

run_command("v.overlay",
             overwrite = True,
             ainput = "jena_boundary@PERMANENT",
             alayer = "1",
             atype = "auto",
             binput = "MaskFeature@PERMANENT",
             blayer = "1",
             btype = "area",
             operator = "not",
             output = "region_mask",
             olayer = "1,0,0",
             snap = 1e-8)
by
from grass.pygrass.modules import Module

Module("v.overlay",
       overwrite = True,
       ainput = "jena_boundary@PERMANENT",
       alayer = "1",
       atype = "auto",
       binput = "MaskFeature@PERMANENT",
       blayer = "1",
       btype = "area",
       operator = "not",
       output = "region_mask",
       olayer = "1,0,0",
       snap = 1e-8)
Warning
There are few caveats. Mupliple options given as a string in GRASS Scripting Library must be replaced by a list of strings in PyGRASS, see v.clean example below.
run_command("v.clean",
            ...
            type = "point,line,boundary,centroid,area,face,kernel",
            ...
Module("v.clean",
       ...
       type = ["point","line","boundary","centroid","area","face","kernel"],
       ...
Let’s improve the script by printing NDVI value statistics (be aware of indentation which is crucial for Python syntax) as described in Unit 10.
    ret = Module('r.univar', flags='g', map='ndvi', stdout_=PIPE)
    stats = parse_key_val(ret.outputs.stdout)
    print ('-' * 80)
    print ('NDVI value statistics')
    print ('-' * 80)
    print ('NDVI min value: {0:.4f}'.format(float(stats['min'])))
    print ('NDVI max value: {0:.4f}'.format(float(stats['max'])))
    print ('NDVI mean value: {0:.4f}'.format(float(stats['mean'])))
Note
Import relevant functions
from grass.script import parser, parse_key_val
from grass.pygrass.modules import Module
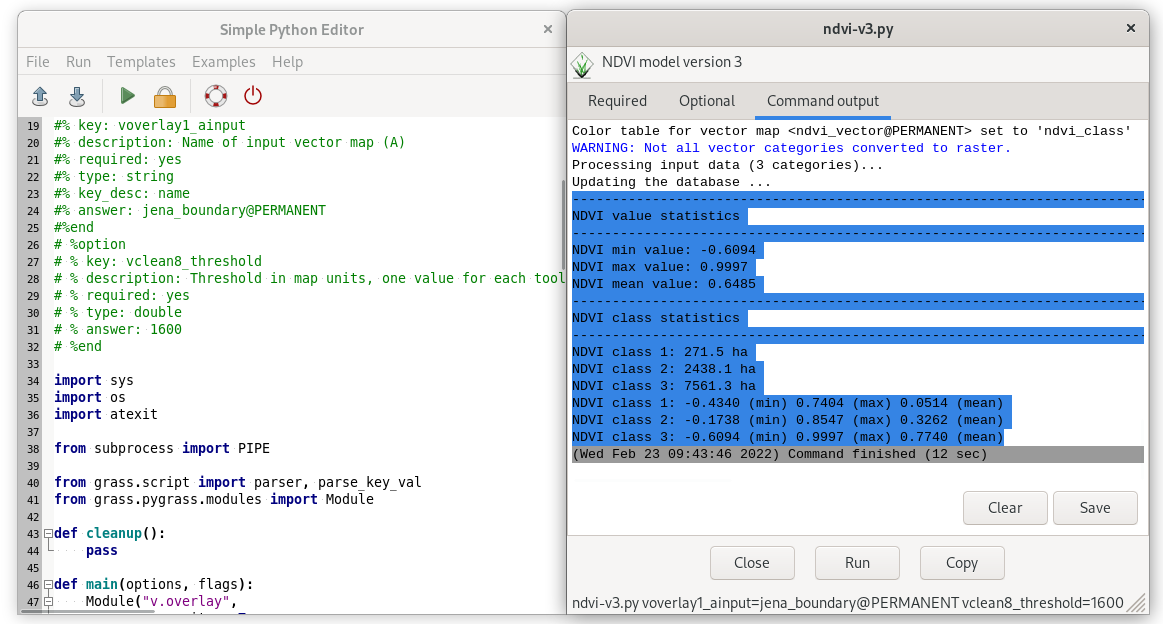
Fig. 77 Launch script by  Run and check out an output
in Console tab.
Run and check out an output
in Console tab.
Statistics
Let’s add additional NDVI classes statistics computed by v.report.
    print ('-' * 80)
    print ('NDVI class statistics')
    print ('-' * 80)
    ret = Module('v.report', map='ndvi_vector', option='area', stdout_=PIPE)
    for line in ret.outputs.stdout.splitlines()[1:]: # skip first line (cat|label|area)
        # parse line (eg. 1||2712850)
        data = line.split('|')
        cat = data[0]
        area = float(data[-1])
        print ('NDVI class {0}: {1:.1f} ha'.format(cat, area/1e4))
Output of v.report module need to be parsed. Unfortunately
the command does not offer a shell script output similarly to
r.univar. Python fuctions like splitlines() and
split() can be used.
Let’s compute also zonal statistics for each NDVI class by v.rast.stats. Zonal attributes can be printed by v.db.select tool.
Todo
Can be simplified since this statistics is already reported by v.report
    # v.to.rast: use -c flag for updating statistics if exists
    Module('v.rast.stats', flags='c', map='ndvi_vector', raster='ndvi',
           column_prefix='ndvi', method=['minimum','maximum','average'])
    # v.db.select: don't print column names (-c)
    ret = Module('v.db.select', flags='c', map='ndvi_vector', separator='comma', stdout_=PIPE)
    for line in ret.outputs.stdout.splitlines():
        # parse line (eg. 1,,-0.433962264150943,0.740350877192983,0.051388909449992)
        cat,label,min,max,mean = line.split(',')
        print ('NDVI class {0}: {1:.4f} (min) {2:.4f} (max) {3:.4f} (mean)'.format(
        cat, float(min), float(max), float(mean)))
Example of script output below.
--------------------------------------------------------------------------------
NDVI value statistics
--------------------------------------------------------------------------------
NDVI min value: -0.6094
NDVI max value: 0.9997
NDVI mean value: 0.6485
--------------------------------------------------------------------------------
NDVI class statistics
--------------------------------------------------------------------------------
NDVI class 1: 271.3 ha
NDVI class 2: 2438.7 ha
NDVI class 3: 7561.0 ha
--------------------------------------------------------------------------------
NDVI class 1: -0.4340 (min) 0.7404 (max) 0.0514 (mean)
NDVI class 2: -0.1738 (min) 0.8547 (max) 0.3262 (mean)
NDVI class 3: -0.6094 (min) 0.9997 (max) 0.7740 (mean)
Sample script to download: ndvi-v3.py
Úkol
In order to simplify testing and improve code readability
split code into two Python functions: compute() and stats().
def main(options, flags):
    compute(options)
    stats(options)

    return 0